MCP Tools for IT Management: What Breeze Exposes and What You Can Do
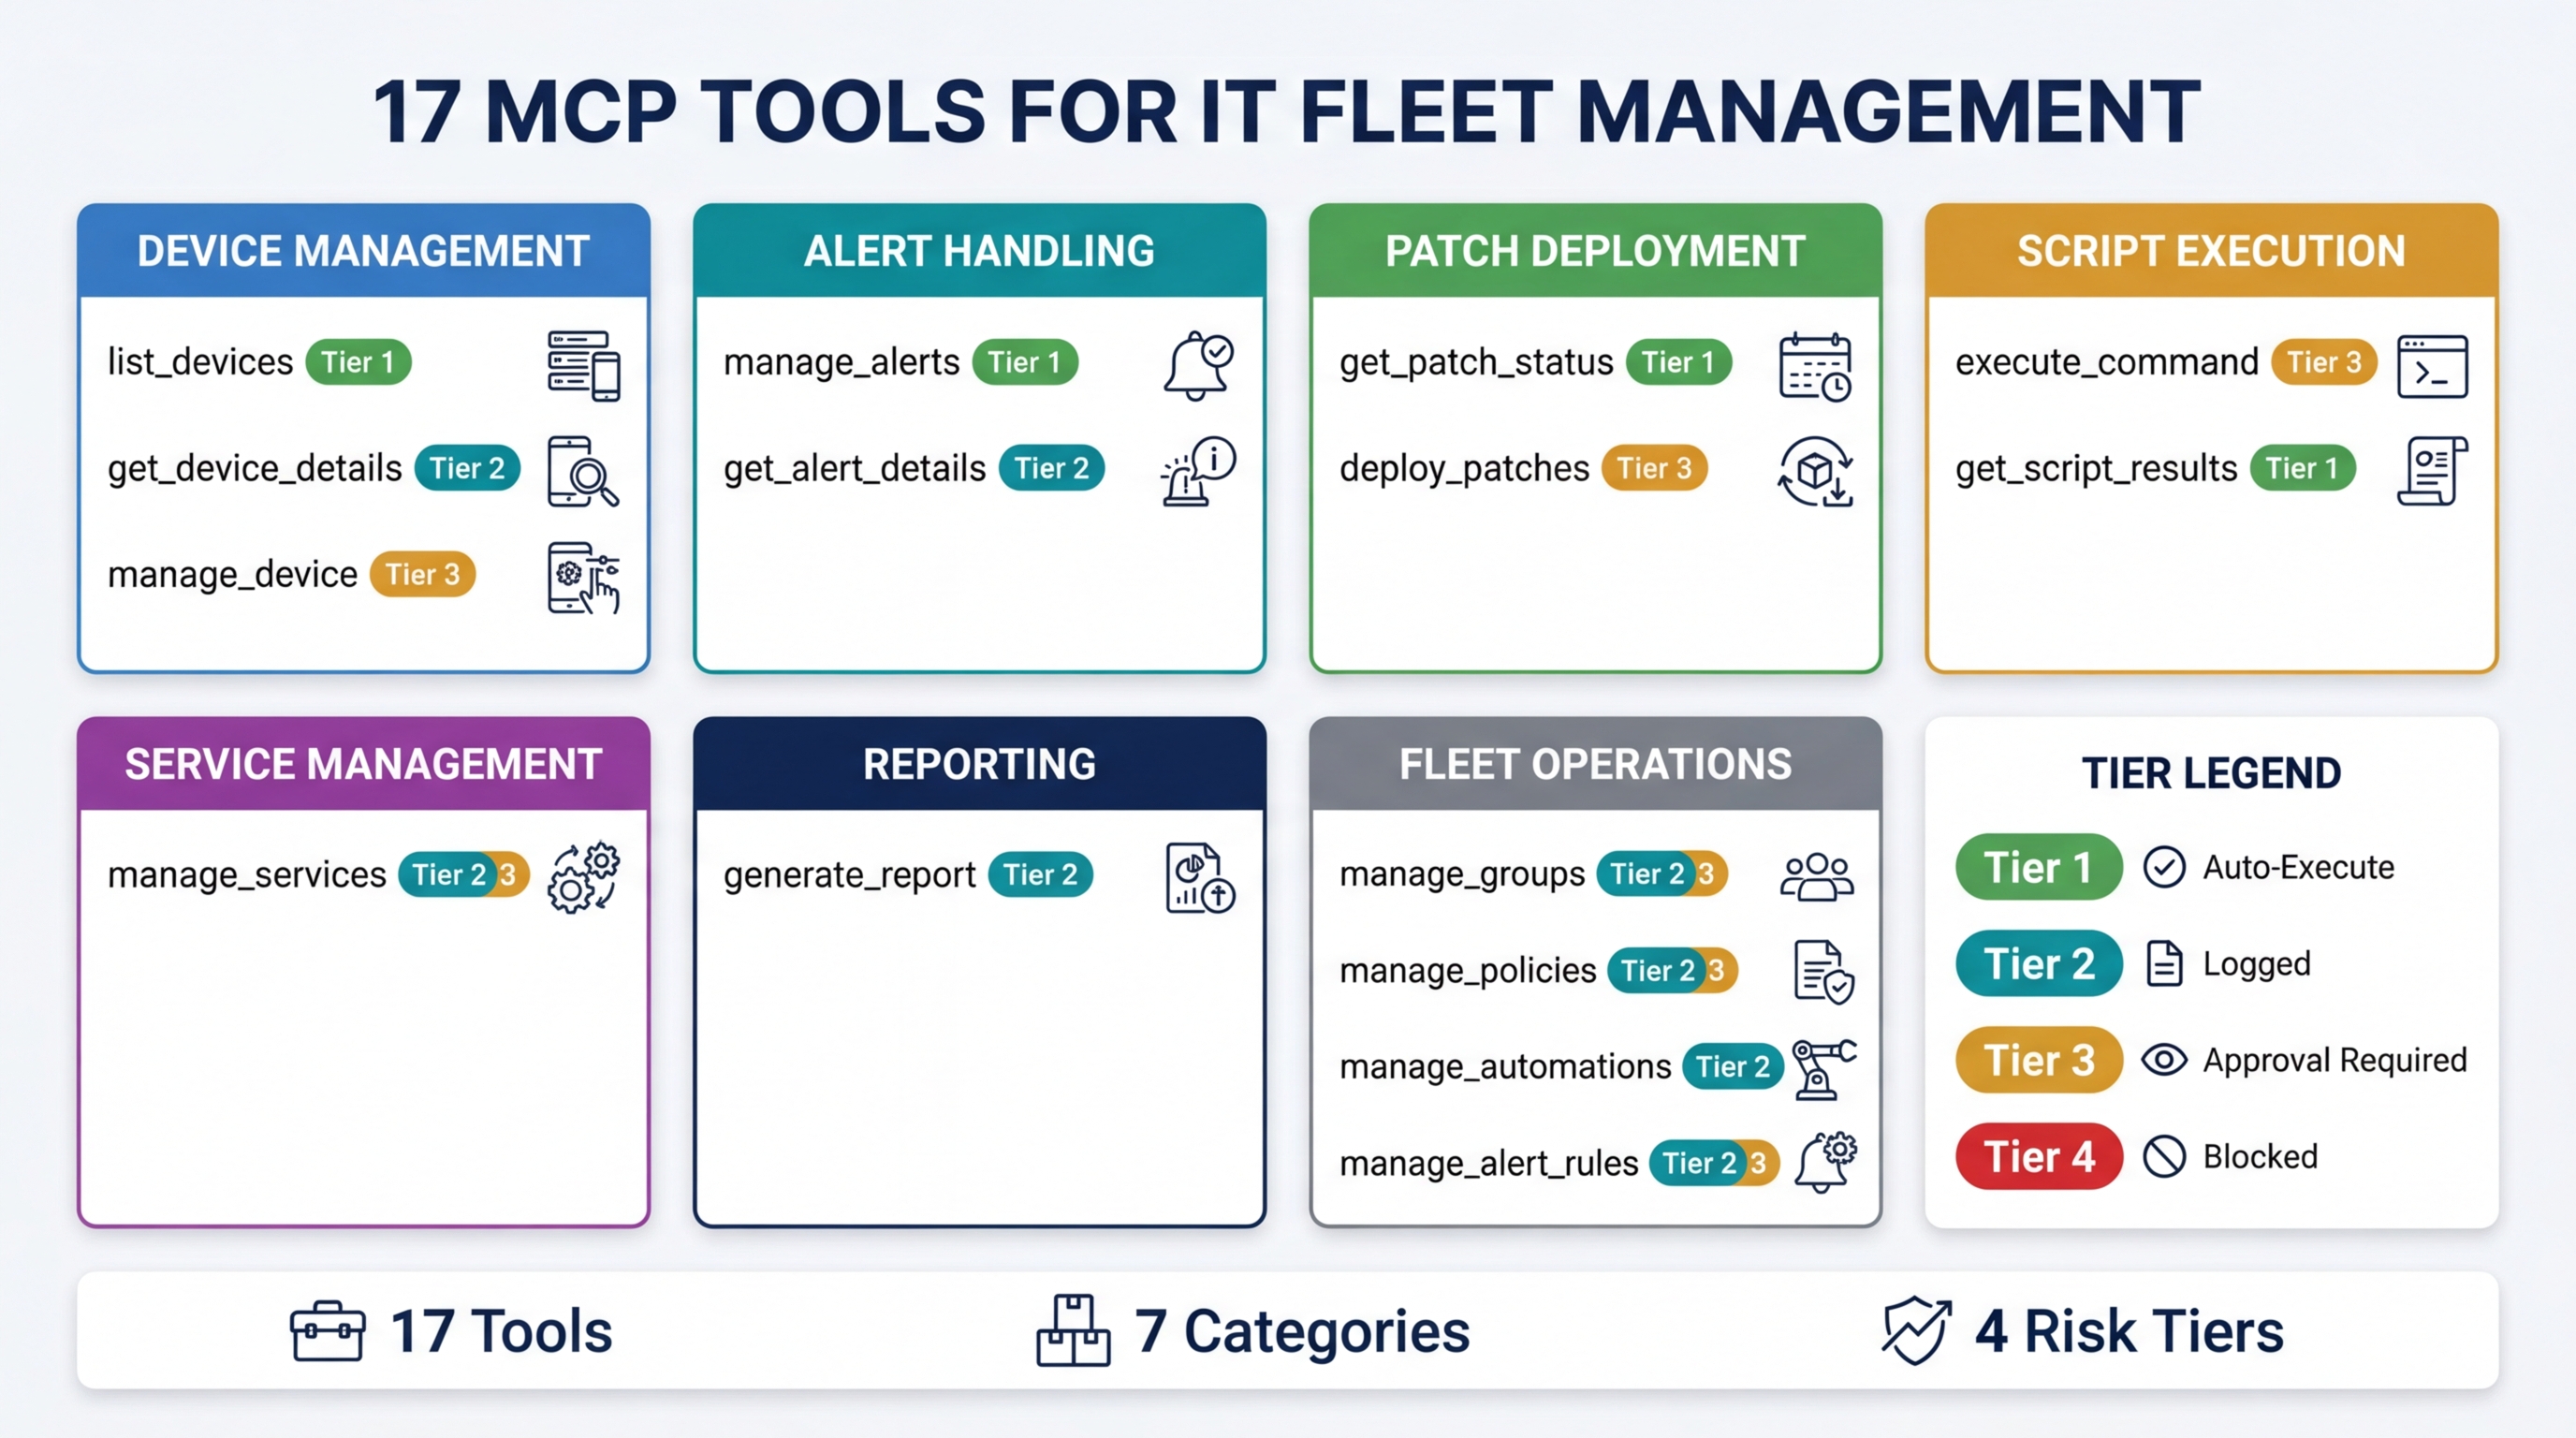
Breeze exposes 17 MCP tools that give AI assistants real operational access to your device fleet. Not a chatbot that summarizes dashboards. Not a natural language wrapper around a search bar. Actual tools — discrete operations that an AI client can call to read fleet state, triage alerts, deploy patches, run scripts, and generate reports.
This post documents every tool: what it does, what risk tier it runs at, and what you can do with it. If you are evaluating MCP for IT management, wondering what an “AI-powered RMM” actually means in practice, or building integrations against the Breeze MCP server, this is your reference.
How MCP Tools Work in Breeze
MCP (Model Context Protocol) is an open standard that lets AI clients — Claude Desktop, Cursor, or any compatible application — call tools exposed by external servers. Breeze runs an MCP server that exposes 17 tools covering the full operational surface of an RMM platform.
Here is how the interaction works:
-
Each tool is a discrete operation. “List devices”, “deploy patches”, “run script” — these are not suggestions or chat responses. They are structured function calls with defined input schemas. The AI knows exactly what parameters each tool accepts and what the return format looks like.
-
Every call is validated before execution. The MCP server checks API key scopes, RBAC permissions, tenant isolation boundaries, and risk tier requirements before any tool runs. A read-only API key cannot deploy a patch. A technician scoped to Client A cannot query Client B’s devices. These constraints are enforced at the server level, not by the AI client.
-
Results are structured data, not prose. When the AI calls
list_devices, it gets back a JSON payload with device records — not a paragraph describing your fleet. The AI client then formats this data for you, but the underlying interaction is machine-to-machine. -
Risk tiers gate dangerous operations. Not every tool runs automatically. Read-only queries execute instantly. Destructive operations require explicit approval. The tier system (detailed below) determines which tools auto-execute and which pause for human confirmation.
The result is that an AI assistant connected to Breeze can do real work against your fleet — the same operations a technician performs through the web UI, but triggered through natural language and executed through validated API calls.
The 17 MCP Tools
Device Management
| Tool | What It Does | Risk Tier |
|---|---|---|
list_devices | Query fleet state with filters: OS, status, group, last-seen time | Tier 1 |
get_device_details | Full device record — hardware specs, installed software, status, performance metrics, group membership | Tier 1 |
manage_device | Reboot, shutdown, lock, or wake a device | Tier 2/3 |
list_devices is the most frequently called tool in practice. Most workflows start here — “show me all Windows devices that haven’t checked in today” or “which devices in the Seattle group are running low disk space.” The tool accepts filters for operating system, online status, device group, and custom tags.
manage_device operates at different risk tiers depending on the action. Locking a device is Tier 2 — logged but auto-executed. Rebooting during a defined maintenance window is also Tier 2. Rebooting outside a maintenance window, or shutting down a production server, escalates to Tier 3 and requires human approval.
Alert Management
| Tool | What It Does | Risk Tier |
|---|---|---|
manage_alerts | List, filter, acknowledge, or resolve alerts across the fleet | Tier 1 (reads) / Tier 2 (writes) |
get_alert_details | Full alert context — severity, affected device, timeline, related events | Tier 1 |
Alerts are the starting point for most reactive IT work. manage_alerts handles both querying (“show me all critical alerts from the last hour”) and state changes (“acknowledge this alert”, “mark as resolved”). Read operations run at Tier 1. Writing operations — acknowledging or resolving — run at Tier 2 because they change alert state but do not affect devices directly.
get_alert_details returns the full context around a single alert: what triggered it, which device is affected, when the condition started, whether it has been acknowledged, and any related alerts on the same device. This context is what the AI uses to make triage recommendations.
Patch Management
| Tool | What It Does | Risk Tier |
|---|---|---|
get_patch_status | Patch compliance per device or fleet-wide — missing patches, pending installs, failed deployments | Tier 1 |
deploy_patches | Schedule and deploy patches with targeting by device, group, OS, or severity | Tier 3 |
get_patch_status is a read-only compliance check. “How many devices are missing critical patches?” or “Show me the patch status for the Accounting group.” The tool returns structured data that includes patch names, KB numbers, severity ratings, and deployment status.
deploy_patches is Tier 3 — always requires human approval. Patching modifies production systems and may trigger reboots. The tool accepts targeting parameters (specific devices, groups, OS filters), scheduling options (immediate or maintenance window), and patch selection criteria (severity, vendor, specific KB numbers). The AI can prepare the deployment plan, but a human confirms before anything installs.
Script Execution
| Tool | What It Does | Risk Tier |
|---|---|---|
execute_command | Run PowerShell, Bash, or Python scripts on target devices | Tier 3 |
get_script_results | Retrieve output from previous script executions | Tier 1 |
execute_command is the most powerful tool in the catalog and runs at Tier 3 without exception. The AI can write a diagnostic script, target it at specific devices, and propose execution — but the human approves before anything runs. This is the right tradeoff: AI can generate scripts faster than most technicians can write them, but arbitrary code execution on production endpoints should never be fully automated.
get_script_results retrieves output from previously executed scripts. This is Tier 1 because it is read-only — the script already ran, and you are just looking at what it returned.
Service Management
| Tool | What It Does | Risk Tier |
|---|---|---|
manage_services | Start, stop, or restart Windows services on target devices | Tier 2/3 |
Service management is the classic “simple fix that resolves 40% of alerts.” A stopped print spooler, a crashed monitoring agent, a hung application service — restarting the service fixes the problem without further investigation. manage_services handles start, stop, and restart operations.
The risk tier depends on the service and context. Restarting a non-critical service like the print spooler runs at Tier 2. Stopping a critical service or restarting a service on a production server escalates to Tier 3.
Reporting
| Tool | What It Does | Risk Tier |
|---|---|---|
generate_report | Create compliance, inventory, security, or executive summary reports | Tier 2 |
Report generation runs at Tier 2 — auto-executed but logged. The tool produces structured reports covering patch compliance, device inventory, security posture, or executive-level fleet summaries. Reports can be scoped to specific device groups, time ranges, or compliance frameworks.
This tool is particularly useful at the end of multi-step workflows. After triaging alerts or auditing patch compliance, the AI can generate a report that documents what was found and what actions were taken.
Documentation
| Tool | What It Does | Risk Tier |
|---|---|---|
create_runbook | Generate operational documentation for recurring procedures | Tier 1 |
create_incident_note | Document incident findings, diagnostic steps, and resolution details | Tier 1 |
Both documentation tools run at Tier 1. They create records — they do not modify device state. create_runbook generates step-by-step operational procedures based on the actions the AI just performed or based on a described workflow. create_incident_note captures the details of a specific incident: what was wrong, what diagnostics were run, what fixed it, and what to watch for.
These tools address one of the persistent pain points in IT operations: documentation debt. Technicians fix problems and move on without documenting the resolution. When the AI handles documentation as part of the workflow, the knowledge gets captured automatically.
Fleet Operations
| Tool | What It Does | Risk Tier |
|---|---|---|
manage_groups | Create, modify, or assign device groups | Tier 2 |
manage_policies | View and apply configuration policies to devices or groups | Tier 2/3 |
manage_automations | View and trigger automation workflows | Tier 2/3 |
manage_alert_rules | Configure alert thresholds, conditions, and escalation paths | Tier 2/3 |
Fleet operations tools manage the organizational and configuration layer above individual devices. manage_groups handles device grouping — creating groups, renaming them, assigning devices. manage_policies works with configuration policies that define how devices behave: patch schedules, monitoring thresholds, security baselines.
manage_automations and manage_alert_rules configure the automation and alerting infrastructure. Viewing existing configurations runs at Tier 2. Modifying configurations — changing alert thresholds, enabling new automations, applying policies to production groups — escalates to Tier 3.
The Risk Tier System
Every MCP tool call in Breeze is assigned a risk tier that determines how the call is handled. The tier system exists because not all operations carry the same risk. Reading device status and deploying patches to 200 production endpoints are fundamentally different actions, and the system should treat them differently.
| Tier | Behavior | Examples |
|---|---|---|
| Tier 1 | Auto-execute, read-only | List devices, get alert details, view patch status, retrieve script output |
| Tier 2 | Auto-execute, logged and auditable | Acknowledge alerts, generate reports, manage groups, lock devices |
| Tier 3 | Requires explicit human approval | Deploy patches, run scripts, restart production services, modify policies |
| Tier 4 | Blocked — cannot be executed via MCP | Reserved for operations deemed too dangerous for AI-initiated execution |
The same tool can operate at different tiers depending on context. A reboot during a defined maintenance window might run at Tier 2. The same reboot outside the maintenance window escalates to Tier 3. Restarting the print spooler is Tier 2. Stopping SQL Server is Tier 3. The tier system is contextual, not just per-tool.
This design means the AI can move fast on low-risk operations — reading data, acknowledging alerts, generating reports — while humans retain control over anything that could disrupt production. The AI does the preparation work (gathering data, writing scripts, building deployment plans), and the human makes the final call on execution.
Practical Workflow Examples
Individual tools are useful. Chained workflows are where MCP tools become transformative. Here are four workflows that combine multiple tools into real operational sequences.
Alert Triage
A critical alert fires for high CPU on a production server.
manage_alerts— The AI retrieves the alert and identifies the affected device.get_device_details— The AI pulls the full device record: CPU history, running processes, recent changes, installed software.execute_command(Tier 3, requires approval) — The AI writes a diagnostic script to capture the top processes by CPU consumption and proposes running it on the affected device.create_incident_note— After diagnosis, the AI documents the findings: what caused the spike, what was done, and whether follow-up is needed.
Total time from alert to documented diagnosis: minutes instead of the 15-30 minutes it takes a technician to context-switch, log in, investigate manually, and write notes.
Patch Compliance Audit
Monthly compliance review for a client subject to CIS Controls.
get_patch_status— Fleet-wide patch compliance check. The AI identifies which devices are non-compliant, which patches are missing, and the severity distribution.list_devices— The AI filters for non-compliant devices and groups them by criticality and OS.generate_report— The AI produces a compliance report suitable for client review, including patch gap analysis and remediation recommendations.
This workflow replaces what is typically a half-day manual exercise of exporting data, cross-referencing patch databases, and building a slide deck.
Service Recovery
A monitoring alert indicates a critical Windows service has stopped.
manage_alerts— The AI identifies the service-down alert and the affected device.get_device_details— The AI checks the device’s current state, recent event logs, and service history.manage_services— The AI restarts the stopped service. (Tier 2 for non-critical services, Tier 3 for critical services.)manage_alerts— The AI resolves the original alert after confirming the service is running.
For non-critical services, this entire workflow can auto-execute without human intervention. The technician sees a resolved alert with full documentation of what happened and what was done.
Fleet Health Check
Weekly executive summary for a managed client.
list_devices— The AI queries fleet state: total devices, online/offline counts, OS distribution.get_patch_status— Patch compliance across the fleet.manage_alerts— Alert summary for the reporting period: total alerts, severity breakdown, mean time to resolution.generate_report— The AI generates an executive summary combining device health, patch compliance, and alert metrics.
This replaces the weekly report that someone on the team spends an hour assembling from three different screens in the RMM dashboard.
API Key Scopes and Tool Access
Not every API key unlocks every tool. Breeze uses scoped API keys to control which tiers of MCP tools a given integration can access.
| Scope | Unlocks | Use Case |
|---|---|---|
ai:read | Tier 1 only | Monitoring dashboards, read-only queries, compliance checks |
ai:write | Tier 1 + Tier 2 | Alert management, report generation, group management |
ai:execute | Tier 1 + Tier 2 + Tier 3 | Full operational access — patching, scripting, service management |
Scope selection follows the principle of least privilege. A dashboard integration that only displays fleet status needs ai:read. A technician’s Claude Desktop connection that handles alert triage and reporting needs ai:write. Full operational access with ai:execute should be limited to senior technicians or specific automation accounts.
Each scope stacks on the previous one — ai:execute includes everything in ai:write, which includes everything in ai:read. There is no way to grant Tier 3 access without also granting Tier 1 and 2. This prevents configurations where an integration can deploy patches but cannot read device status, which would be incoherent.
Where to Go From Here
This tool catalog is the same whether you connect through the Breeze web UI, Claude Desktop, Cursor, or any MCP-compatible client. The tools, the risk tiers, the scope restrictions, and the validation logic are all server-side. Your choice of client determines the interface, not the capabilities.
If you want to set up the connection: How to use your RMM from Claude Desktop or Cursor walks through the configuration step by step.
If you want to understand the MCP server architecture: the MCP Server feature page covers how Breeze implements the protocol, including authentication, tool registration, and streaming.
If you are self-hosting and want to configure the AI layer: Configuring Breeze AI: The Self-Hoster’s Guide covers model selection, context windows, and behavior tuning.
These 17 tools represent what Breeze can do today. The tool catalog will grow as the platform adds capabilities, and every new tool will follow the same pattern: defined schema, validated execution, risk-tiered access. The protocol is stable. The surface area expands.