The Response Controls: Recovery, Network, and Incident Response
At 2:10am on a Tuesday, an RDP session opens on SERVER-002 from an internal IP that nobody should be using at that hour. Two minutes later, a scheduled task is created running encoded PowerShell. At 2:15, a USB storage device is connected and blocked by policy. At 2:18, a DNS query for a known command-and-control server is blocked by the DNS filter. At 2:20, SentinelOne flags process injection in svchost.exe.
Five signals. Four systems. Ten minutes.
If each of those signals lands in a separate dashboard, in a separate product, logged by a separate tool that has no awareness of the others, what your analyst sees at 7am is five unrelated alerts — one from your RMM, one from Huntress, one from SentinelOne, one from your DNS filter. What they do not see is that those five alerts describe a single incident that unfolded in sequence, that the attacker’s first action was lateral movement via RDP, and that containment was needed ten minutes after the first signal, not the next morning when someone opens their ticket queue.
This is the problem that CIS Controls 11, 12, 13, and 17 are written to solve. And it is where the gap between “we have documented procedures” and “we can execute automatically” is not just operational inefficiency — it is the difference between containing an incident and discovering you were breached.
CIS Control 11: The Backup Nobody Tested
Most organizations know their backup jobs are running. Backup software sends success emails. Dashboards show green. The backup administrator can confirm that jobs complete nightly. What they cannot confirm — without actually running a test restore — is whether those backups would survive contact with reality.
This has a name: Schrodinger’s backup. It is simultaneously working and broken until someone tries to restore from it.
The problem is not that organizations fail to run backups. It is that testing restores is operationally painful, so it happens quarterly at best, annually at worst, and the results are noted in a spreadsheet that no one consults when an incident occurs. When ransomware encrypts a file server at 11pm on a Friday and the recovery conversation begins, the first question is “when did we last successfully restore from this?” The honest answer is often “we ran a test eight months ago and it worked then.”
BE-29 runs three types of backup verification automatically. An integrity check runs after every backup — verifying checksums, encryption, and completeness of the backup archive without restoring it. A test restore runs weekly — it pulls files from the backup to a temporary location, verifies file integrity, measures restore time, and cleans up. Full recovery tests are configurable by scope and can run monthly. The results accumulate into a continuous record: restore time per device, files verified versus files failed, backup age at test time.
That last metric — backup age at time of test — is what converts backup verification from a compliance checkbox into a business answer. When a client asks “how fast can you recover us?” the honest answer from most MSPs is an estimate based on assumptions. With BE-29 running weekly test restores and measuring actual restore duration per device, the answer is a data-backed number. Fleet-wide average recovery time across your managed environment is a real figure. If 12 of 40 devices would exceed a two-hour RTO based on observed test restore timing, that is information a client’s disaster recovery plan needs to account for — not discover during an actual disaster.
The RTO/RPO conversation used to be aspirational. It is now measurable.
CIS Control 12: The Network Change Nobody Authorized
Network infrastructure management is the control that looks well-covered until something goes wrong with a switch or firewall that nobody remembered to document.
BE-30 handles network device configuration management: backing up running and startup configs via SSH (show run/startup) or SNMP, diffing between snapshots to detect changes, tracking firmware versions against EOL status and known CVE counts. Supported device classes span the common enterprise and SMB stack — Cisco IOS and IOS-XE, Ubiquiti UniFi, Meraki via Dashboard API, Fortinet, SonicWall, pfSense, and generic SNMP targets.
The value of config backup is obvious. The value of diff-based change detection is less obvious until you encounter the scenario it is designed for.
A core switch config changes two hours after a scheduled maintenance window closed. The diff shows that ACL 101 was modified — three new permit rules were added allowing inbound traffic on ports 8080 through 8090. The change was not in the change log. The last SSH login to the device came from an internal IP. That is not a configuration drift event. That is an unauthorized network change, and the question is not whether to investigate — it is whether to immediately revert to the previous config while the investigation runs.
Firmware tracking adds a layer that most network management tools handle superficially. Knowing that a firewall is running FortiOS 7.0.3 is not useful by itself. Knowing that FortiOS 7.0.3 reached end-of-life six months ago and has four known CVEs, with the latest stable release at 7.4.2, is actionable. The difference between reporting and analysis is whether the platform correlates the version against EOL and CVE data automatically or leaves that cross-reference as a manual step.
BE-4 covers network diagnostics as a complement to configuration management: traceroute, DNS diagnostics, latency baselines, MTU discovery, WiFi diagnostics (signal strength, noise floor, channel, BSSID, roaming events), speed tests, and network change detection. The intent is not just to surface measurements but to use them diagnostically. When a user reports slow internet, the brain does not return raw numbers — it reasons through them. A WiFi signal at -78dBm is poor. Combined with a 340ms DNS resolution time on a device that should see under 50ms, and three competing APs on the same 2.4GHz channel, the picture becomes a recommendation: move to 5GHz, change DNS to 1.1.1.1. The follow-up question is whether to push that configuration change automatically.
That is a different relationship with network data than a dashboard full of charts.
CIS Control 13: Rogue Devices and Network Awareness
CIS Control 13 covers network monitoring and defense. Much of the underlying infrastructure — continuous scanning (BE-18), auto-discovery to auto-monitoring pipeline (BE-5), DNS filtering (BE-28) — has been covered in earlier posts in this series as it relates to asset inventory and browser/DNS protection. The Control 13 framing shifts the purpose: these capabilities are not just inventory tools, they are threat detection signals.
A device that appears on a network segment it has never appeared on before is not an inventory event. It is a potential intrusion signal. New device alerting (BE-18) fires on first contact with an unrecognized device — it does not wait for the next scheduled scan. The alert includes fingerprinting data: MAC address, vendor, open ports, detected protocols. Whether that device is a contractor’s laptop or a threat actor’s bridging device is a judgment call, but the platform ensures the question is asked in real time rather than discovered in a log review.
Alert correlation suppression matters here and is underappreciated. When a gateway device goes offline, every device behind it appears to fail its monitoring check simultaneously. A naive monitoring system generates an alert for each device — dozens or hundreds of alerts that bury the actual signal (the gateway failure) in noise. BE-5 implements correlation suppression: if the upstream gateway is down, downstream device alert generation is suppressed, and the single gateway failure event is what surfaces. Baseline observation before threshold setting means that a device with normally variable latency does not generate alerts on variance — it generates alerts on deviation from its own observed baseline. These are the differences between a monitoring system that helps and one that trains people to ignore alerts.
DNS filtering (BE-28) in the Control 13 context is network-layer threat detection. Every blocked domain request is logged with device attribution, threat category, and timestamp. The C2 query that was blocked at 2:18 in the incident timeline above is not an anonymous event — it is attributed to a specific process on a specific device at a specific time. That attribution is what makes DNS blocks useful as investigation signals rather than just prevention mechanisms.
CIS Control 17: When a Policy Document Is Not a Response Plan
Most organizations have an incident response plan. Most could describe, at a high level, the phases of their response process: detect, contain, investigate, recover, report. Many have documented those phases in a binder or a SharePoint folder. A meaningful fraction have tested their plan in a tabletop exercise. Far fewer have tested their plan under conditions that approximate a real incident — at 2am, with personnel available by phone if at all, against an attacker who has already been present on the network for ten minutes before the first alert fires.
The gap between documented procedures and executable response is where organizations fail. Not because their plans are wrong, but because plans are written under the assumption that experienced personnel will be available to execute them. When an incident starts at 2am on a Tuesday, the assumption breaks. The plan says “isolate the affected device.” The 2am question is which device, how, and with what tool — questions that require both knowledge and platform access that may not be immediately available.
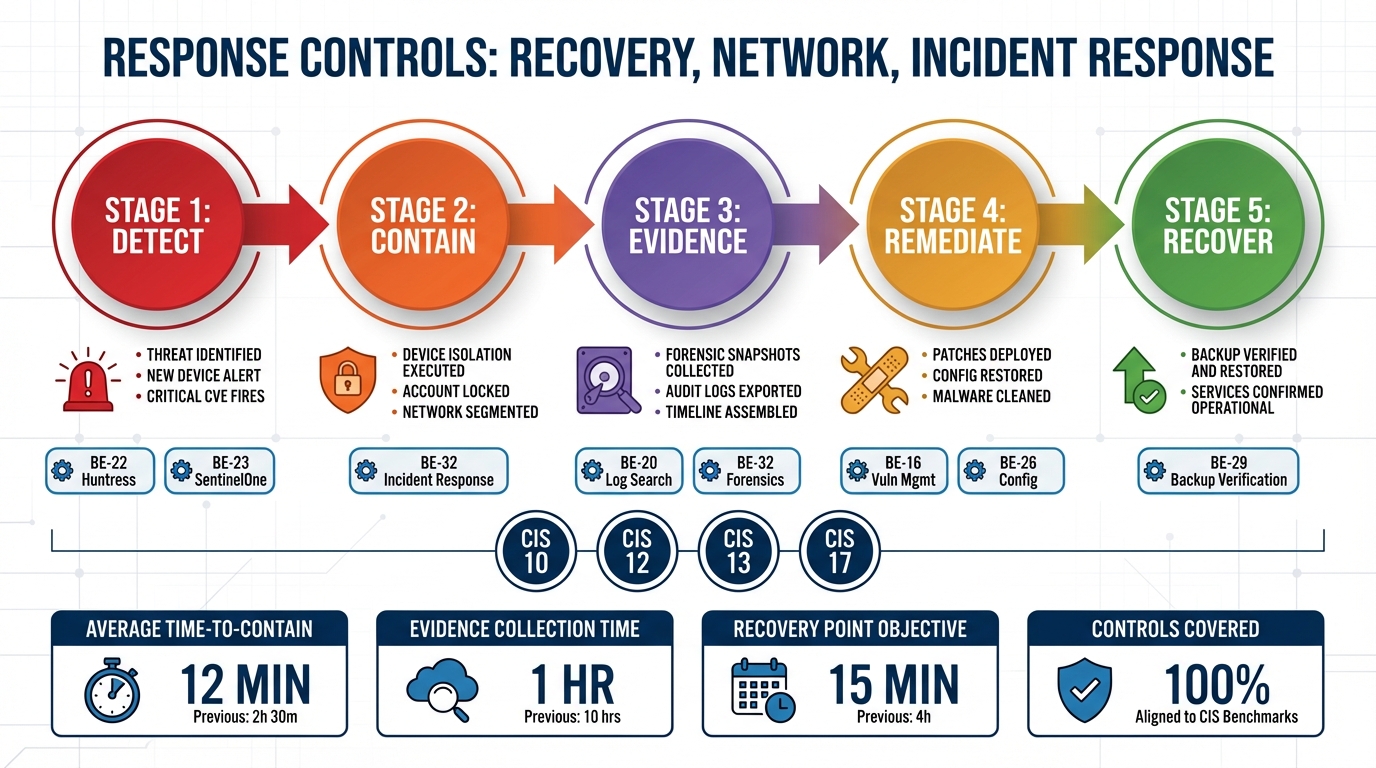
BE-32 implements a full NIST 800-61 incident response workflow as a native platform capability across all five phases.
Detection and analysis begins with signal correlation. Individual alerts from Huntress, SentinelOne, DNS filters, USB policy enforcement, and the RMM itself are correlated into incidents rather than handled as isolated events. The platform auto-classifies incident types — malware, unauthorized access, data exfiltration, policy violation, insider threat — and assigns severity P1 through P4 based on signal pattern and asset criticality. A P1 classification does not wait for a human to connect the dots across four different product dashboards.
Containment actions are selected based on incident type and severity and executed without requiring the analyst to log into four separate products. Network isolation via SentinelOne or firewall rules. Account disable. Process kill. USB block. These are not manual runbook steps — they are actions the platform initiates based on incident classification.
Evidence collection runs in parallel with containment. Memory snapshots capture the process list, network connections, and loaded DLLs at the time of detection. File preservation copies suspicious files before deletion or modification. Log capture collects event logs, agent logs, and the change timeline. Network capture pulls recent connections and DNS queries. If a user session is active, a screenshot is collected. Every piece of evidence is stored with chain-of-custody metadata: who collected it, when, and the cryptographic hash of the collected artifact. That metadata is not optional — it is what makes the evidence usable in a post-incident review, an insurance claim, or a regulatory inquiry.
Recovery follows containment verification: confirm the containment was effective, restore from a known-good backup via BE-29, re-enable network access, reset compromised credentials, verify device health. The recovery steps reference the same backup infrastructure that is being continuously verified under Control 11 — the test restore timing data from BE-29 is what makes the recovery timeline estimate credible.
Post-incident reporting is generated automatically: full incident timeline, containment actions taken with timestamps, evidence collected with custody chain, lessons learned based on the incident pattern, suggested policy or configuration changes. This report is not assembled after the fact from memory and scattered logs — it is produced as a byproduct of the structured response workflow.
What IR-2026-0042 Actually Looked Like
The incident described at the opening of this post — five signals across four systems in ten minutes — is not a hypothetical. It reflects how these incidents actually unfold: incrementally, across multiple platforms, with each individual signal below the threshold that would trigger immediate human response but the combined pattern well above it.
IR-2026-0042 was classified Severity P1 Critical, malware plus possible data exfiltration. The timeline reconstructed by the platform: 02:10, RDP login to SERVER-002 from 10.0.1.99 using the admin_temp account. 02:12, Huntress alert for a scheduled task running encoded PowerShell. 02:15, USB storage device connection — blocked by peripheral control policy. 02:18, DNS query for a known C2 server — blocked by DNS filter. 02:20, SentinelOne process injection detected in svchost.exe.
Containment executed automatically: SERVER-002 isolated via SentinelOne, admin_temp account disabled, source IP 10.0.1.99 blocked at the firewall. Evidence collected: process dump, active network connections, scheduled task details, full RDP session log.
Without cross-system correlation, each of those signals generates its own alert in its own product. The Huntress alert looks like a detection that was handled. The DNS block looks like a routine C2 query that was stopped. The SentinelOne alert looks like a process injection event — serious but not obviously connected to the RDP session thirty-seven seconds earlier. The analyst reviewing the morning queue sees five separate items. They do not see a single incident with a coherent attacker timeline, a compromised account, and a source IP that needs to be blocked at the perimeter.
The difference between those two pictures — five isolated alerts versus one correlated incident with automated containment — is the difference between a response that happens at 2am and one that starts at 7:30am, after the attacker has had five and a half hours of uncontested access.
The Automation Gap Is the Real Risk
The controls covered in this post — data recovery, network infrastructure management, network monitoring, and incident response — are not controls that organizations typically ignore. They have backup software. They have network devices they manage. They have monitoring tools. They have incident response plans.
What they often do not have is the automation layer that converts policies into actions and generates evidence that the actions happened. The backup job runs but the restore has not been tested in eight months. The firewall config changed but nobody noticed because diffing configs requires someone to manually pull and compare them. The DNS block fired but the attribution log is in a separate product from the RDP login record. The IR plan exists but it assumes personnel availability and manual execution across four different platforms.
The controls are not missing. The automation to execute them is.
CIS Controls 11, 12, 13, and 17 are where the difference between “we have documented procedures” and “we can execute automatically, with evidence, regardless of what time the incident starts” is most consequential. In a mature security program, these controls function continuously — not because someone remembered to check them, but because the platform executes them as a matter of course and the evidence accumulates in a structured record.
That is what LanternOps surfaces across the Breeze-managed fleet: the continuous execution record, the correlation layer that connects signals across integrated products, and the incident response workflow that converts a 2am alert cascade into a contained, documented, reported incident. The policy document describes what should happen. The automation determines whether it does.