The Hidden Cost of Your Compliance Stack
Track 1, Post 2 of the Breeze RMM blog series
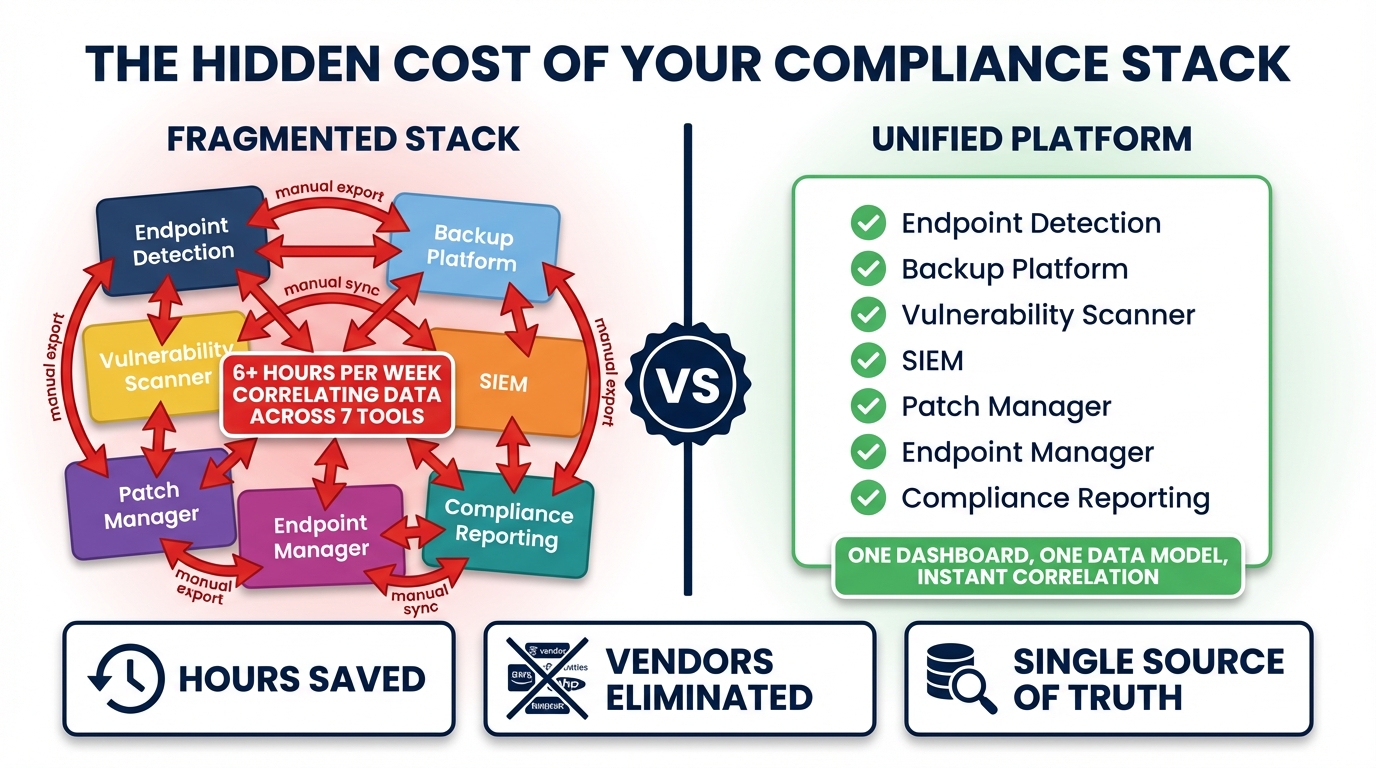
The moment usually arrives around vendor number seven. You have patch management, an EDR, a SIEM, a vulnerability scanner, a backup solution, a PAM tool, and your RMM holding everything loosely together. You have seven dashboards, seven billing relationships, seven sets of alerts, seven renewal conversations per year. And when a client calls to ask about their security posture, you spend an hour pulling data together from all of them before you can give an answer.
That hour is the real cost of the fragmented compliance stack. Not the licensing. Not the integration work. The hour, repeated across every client, every incident, every audit request, by your most experienced and most expensive people.
The Stack Nobody Planned
Most MSP compliance stacks were not designed. They were assembled, tool by tool, as the industry’s threat model matured and clients started asking harder questions. Four years ago, you needed patch management. Then your cyber insurance carrier started asking about EDR. Then a client got hit with ransomware and suddenly you needed a SIEM. Then someone’s audit failed because there was no privileged access management. Then backup alone was not enough — you needed backup verification.
Each tool was a reasonable response to a real problem. The stack that emerged from those decisions is not. The typical compliance-capable MSP today runs something close to this:
- Patch management: Automox, Action1, or a native RMM feature
- EDR: Huntress, SentinelOne, or CrowdStrike Falcon
- SIEM / log aggregator: Datto SaaS Alerts, Blumira, or a stacked Elastic deployment
- Vulnerability scanner: Nessus, Rapid7, or Tenable
- Backup solution: Acronis, Veeam, or Datto BCDR
- PAM tool: BeyondTrust, CyberArk, or Delinea
- Network monitor: PRTG, Auvik, or a built-in RMM feature
That is seven vendors before you count identity providers, DNS filtering, or browser security tools. It is not unusual to reach nine or ten when you factor in the full surface area a modern compliance framework like CIS Controls v8 actually covers.
What Tool Gaps Actually Cost
The licensing total is visible. Open the contracts, add the per-device fees, and you have a number. The number that does not appear on any invoice is the cost of the gaps between tools.
Every hand-off between tools is a place where context gets dropped. When the EDR fires a Huntress alert, your RMM does not know about it. Your patch management tool does not know about it. Your SIEM has its own alert from the same underlying event — different format, different severity classification, different dashboard. Your technician has to pivot between three to four systems, correlate manually, and decide what to do. That correlation work runs 15 to 30 minutes per incident before anyone touches the affected device.
Multiply that by incident volume. For a 200-endpoint MSP, even a modest alert rate of one meaningful security event per 20 endpoints per month produces ten incidents requiring manual correlation. At 20 minutes each, that is more than three hours per month, from your senior technicians, on work that a unified data model should eliminate entirely.
The math gets worse when you consider that these are senior technician hours — not help desk hours. The person doing the correlation is usually the same person who would be designing new service offerings, handling pre-sales engineering calls, or training junior staff. The opportunity cost is invisible on the P&L but real in the business.
The Integration Tax
Every connection between tools in a fragmented stack is technical debt. Someone built it. Someone has to maintain it. When Huntress ships a breaking API change, the integration breaks. When you add a new EDR vendor for a client who requires it, someone has to build the new connection. When your SIEM provider gets acquired and their webhook format changes, that is a weekend.
The integration tax is not just the hours spent building connections. It is the fragility of the result. Webhook-based integrations drop events when the receiving endpoint is temporarily unavailable. API polling introduces latency — the SIEM might see an event twelve minutes after it happened because the polling interval was set to fifteen. Bidirectional integrations — where an action in one tool should trigger a response in another — are rare because they are hard to build correctly and even harder to maintain reliably.
Most MSP integrations between security tools are one-directional, read-only, and built with the assumption that a human is the final aggregator. That assumption is why the technician keeps doing the correlation work.
Alert Fatigue Is an Integration Failure
When tools do not share context, every tool fires its own alerts. The same underlying event — a device with an unpatched critical vulnerability, a suspicious process, a new external connection to a known-bad IP — generates alerts in the EDR, the vulnerability scanner, the SIEM, and the RMM. The technician learns to manage this by creating suppression rules, setting higher severity thresholds, or simply developing a tolerance for noise.
That tolerance is the alert fatigue problem. The technician who has tuned out medium-severity alerts across four systems is the technician who will miss the medium-severity alert that is actually the first sign of a breach. Alert fatigue is not a discipline problem. It is what happens when four systems with independent context models all try to classify the same event and four answers are four times the noise.
The textbook fix is “tune your alerting.” The actual fix is fewer, higher-confidence alerts from a system that knows the full context of the device before it fires. An alert that includes patch status, backup recency, login history, and running processes is actionable. An alert that says “suspicious network connection detected” in isolation requires 20 minutes of context gathering before it is.
The Hidden Headcount
The fragmented stack’s most expensive artifact is the person whose job is to hold it together.
In some MSPs, this is explicit: a compliance coordinator or a senior tech whose remit includes pulling the weekly report from the SIEM, correlating it with patch management status from the RMM, checking backup verification logs, and assembling the evidence package for client QBRs. In others, it is distributed — every tech spends 30 minutes per client per week doing some version of this aggregation work because the tools do not do it automatically.
Either way, the cost does not show up in software budgets. It shows up in labor costs, in technician utilization, in the ceiling on how many endpoints a single technician can manage without dropping quality. MSPs frequently wonder why their gross margins compress as they grow. A meaningful part of the answer is that their compliance tooling scales linearly with endpoint count, and the human aggregation layer scales with it.
What a Unified Data Model Changes
The argument for a unified platform is not that each individual tool is inadequate at its primary function. It is that the combination of tools produces emergent costs that no individual tool’s licensing captures.
When the EDR fires, a unified platform already has the context: what changed on that device in the last 24 hours, who is logged in, what the patch status is, what the backup state is, whether there are any anomalous processes, whether the device has any open vulnerabilities with known exploits. The correlation is immediate because it was never separate to begin with.
Breeze covers this in 32 distinct brain enablement features — capabilities that, in a fragmented stack, would span eight or more vendors. These are not features tacked onto an existing RMM architecture. They are designed as a unified data model from the ground up, with a typed event stream that makes cross-signal correlation possible without human intermediation.
To give a concrete sample of what that means in practice: deep file system analysis, boot performance telemetry, device reliability scoring, network diagnostics, change tracking, hardware health prediction, session intelligence, and security posture scoring all live in the same data layer. Anomaly detection, application whitelisting, vulnerability management with NVD-correlated CVE scanning, privileged access management, new device alerting, and IP history all share the same event stream. Central log search, audit baselines, Huntress integration, SentinelOne integration, sensitive data discovery, USB control, CIS Benchmark hardening, browser extension control, DNS filtering integration, backup verification, network device configuration management, user risk scoring, and incident response automation round out the picture.
In a seven-vendor stack, those capabilities live in separate databases, fire separate alerts, and require a human — or a fragile integration — to correlate them. In a unified platform, they are different views of the same underlying device context.
The EDR alert still fires when Huntress detects a persistent foothold. But the question “what else do I need to know about this device before I respond?” has already been answered. The patch status is there. The last backup was verified two hours ago. The device has not shown anomalous outbound traffic outside this specific process. The session in progress is the device owner’s normal working hours from their usual location. That context does not eliminate the incident — it makes the response fifteen minutes faster and substantially more confident.
Evaluating Your Own Stack
The question to ask is not how many tools you are running but how many times per week a technician acts as the integration layer between them. If that number is high — if incident response regularly starts with context gathering across multiple dashboards before it moves to remediation — the hidden cost of the fragmented stack is already present in your business. It is just allocated to headcount rather than software.
The tooling exists to eliminate that work. It is a different architectural choice from the ground up, not a feature added to a dashboard-centric platform. But the unit economics are straightforward: unified context reduces the per-incident technician time, and that reduction compounds across every client, every month, at every point in the growth curve.
The compliance stack nobody planned is costing more than its invoice total. The invoice is the part you can see.
Next in Track 1: How to Sell CIS Coverage as a Managed Service — packaging continuous compliance as a recurring revenue line.
If you are evaluating the technical architecture behind these claims: Build the RMM First. Then Build the Brain. — the Track 3 case for why unified data models require architectural decisions, not feature additions.
If you want the control-by-control coverage map: 13 of 18 CIS Controls. Automatically. Here’s the Map. — the Track 2 breakdown of what strong coverage actually means in CIS v8 terms.